Data-Driven Cold Chain: IoT Anomaly Detection and Predictive Analytics
Maintaining a robust cold chain is critical for perishable goods like food, pharmaceuticals, and chemicals. Any disruption – from a temperature spike to a refrigeration failure – can quickly spoil products and generate waste. In fact, roughly one‑third of all food produced for consumption is lost or wasted each year. Much of this loss occurs in transport and storage when cold conditions are not maintained. To prevent spoilage, modern logistics increasingly rely on Internet-of-Things (IoT) sensors and data analytics. By continuously monitoring temperature, humidity, GPS location and equipment health, companies can detect anomalies early and even forecast problems before they occur. In this article, I (Apple Ko of Eelink) describe how sensor data from cold‑chain IoT devices feed machine‑learning models for anomaly detection and predictive maintenance, and I summarize industry findings on their impact.
IoT Sensing in Cold Chain Logistics
IoT devices are now ubiquitous in supply-chain logistics. These devices – such as wireless temperature trackers, humidity beacons and GPS gateways – generate streams of time‑series data as shipments move through the network. For example, a typical cold‑chain tracker might record the cargo temperature every few minutes and send this data via LTE‑M or NB‑IoT to a cloud server. With over 16.6 billion IoT devices globally in 2023 (projected to reach 18.8 billion by end of 2024), the data volume is enormous. Handling this data effectively is a major IT challenge, but it enables real‑time visibility: stakeholders can watch sensor readings and locations on dashboards or mobile apps as goods travel from factory to store.
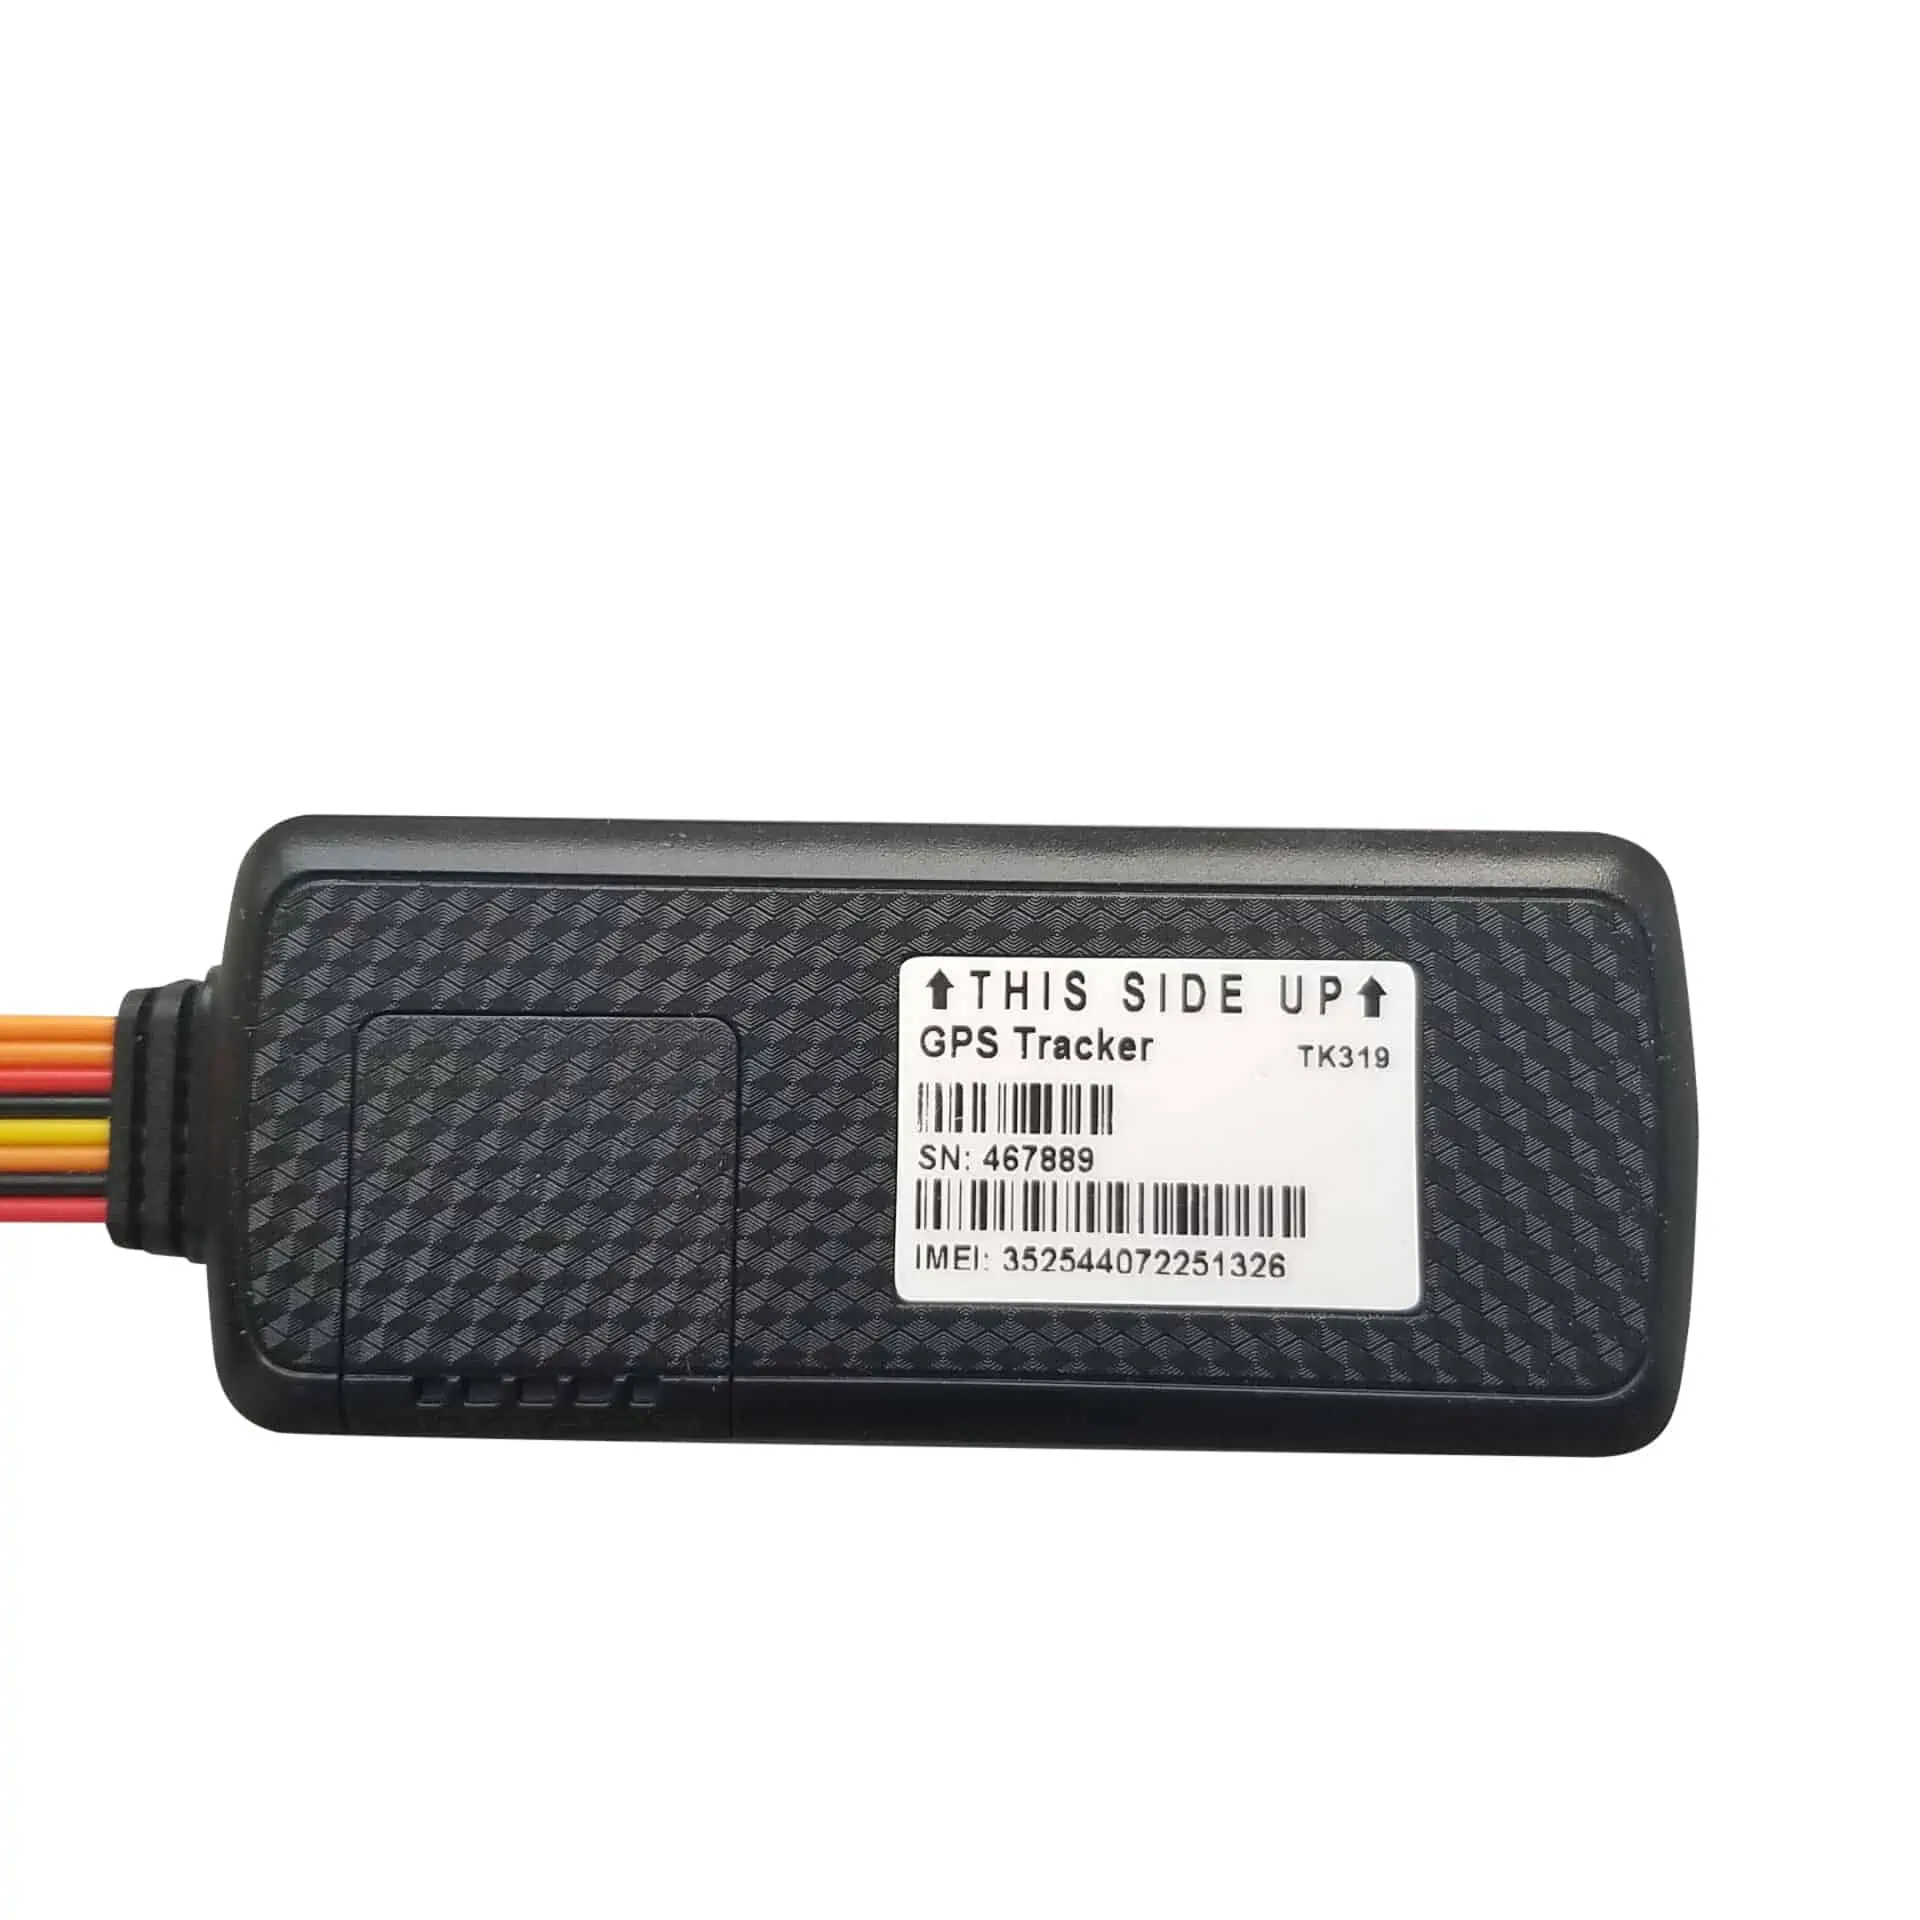
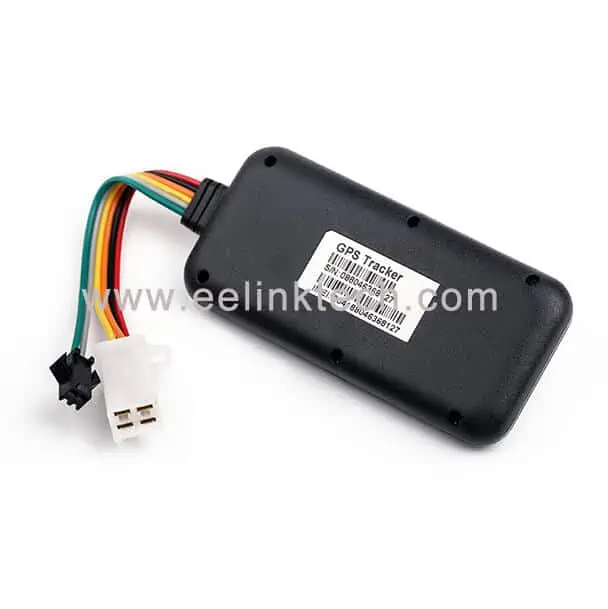
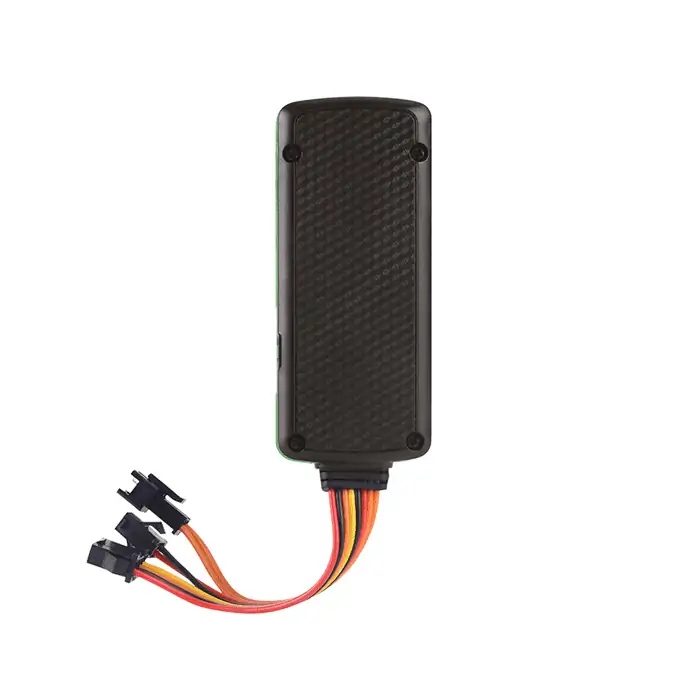
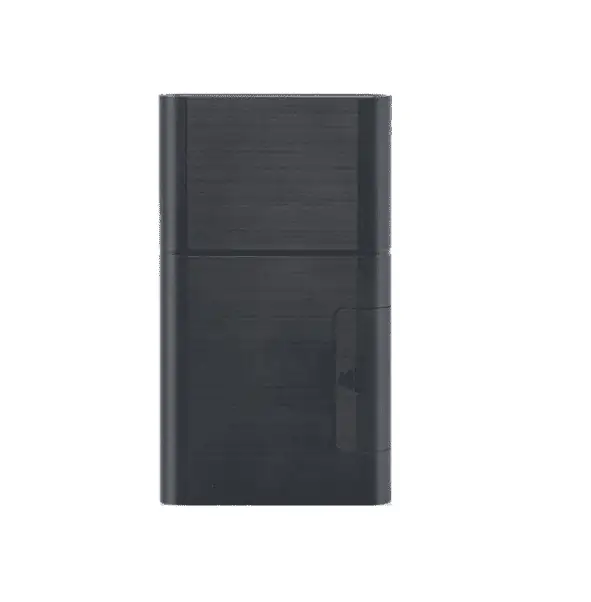
As an example of hardware, Eelink’s IoT asset trackers (e.g. LTE‑M and NB‑IoT trackers with built‑in temp/humidity probes) continuously monitor environmental conditions and position. These devices often have multi‑year battery life and can operate in extreme conditions. (Our BTT01 temperature/humidity beacon is one such sensor.) Data from these devices are timestamped and sent to cloud platforms (via cellular or satellite links); there it is stored in time‑series databases. The incoming data feeds analytics workflows: data scientists run queries on historical temperature series, visualize trends on dashboards, and apply machine‑learning models for anomaly detection.
-
High-resolution sampling. Modern trackers can sample many metrics (temp, hum, acceleration, GPS) at sub-minute to hourly intervals. This yields rich time-series datasets for analysis.
-
Network connectivity. Devices use various networks (4G/LTE‑M, NB‑IoT, LoRaWAN, etc.) to relay data. This guarantees near-real-time monitoring over long trips.
-
Cloud ingestion. Data is typically pushed to IoT platforms or MQTT brokers, then processed by analytics services (e.g. Kafka, time-series DBs, and ML engines).
The value of this data collection is clear: by aggregating sensor streams, companies can improve traceability, enforce regulatory standards, and react quickly to issues. For instance, IoT-based monitoring has been credited with cutting cold-storage energy use by up to 10–30% through analytics-driven optimization. It also drives better resource planning – machine‑learning forecasts of demand or transit times use the same data inputs (e.g. GPS + temperature trends) to optimize routes and schedules. Industry reports note that hundreds of thousands of cold-chain shipments now use IoT trackers to meet strict quality norms.
Time Series Anomaly Detection in Logistics
The core data-science task in cold-chain monitoring is time series anomaly detection. An anomaly is any pattern that deviates from normal behavior – for example, a sudden temperature rise, a stuck cooling valve, or a shipment straying off its planned route. Detecting these anomalies quickly can prevent spoilage. Compared to simple threshold alerts, modern approaches leverage statistical and machine learning methods:
-
Statistical control charts: Early systems used fixed thresholds and control limits. These can catch overt violations but often produce false alarms (e.g. reacting to spurious spikes).
-
ARIMA and Holt-Winters forecasting: Classical time-series models (ARIMA, exponential smoothing) can forecast expected temperature curves and flag when actual readings diverge beyond confidence bands.
-
Machine-learning models: Unsupervised methods like Isolation Forest, One-Class SVM or autoencoders learn the pattern of “normal” data and score deviations as anomalies. Recurrent neural networks (RNNs or LSTMs) can model temporal dependencies; reconstruction errors or prediction errors become anomaly indicators. Recent research even applies advanced models – for example, a GAN‑based architecture with attention achieved over 93% precision and 95% recall on multidimensional IoT sensor data. While that study focused on agriculture, the idea applies to any sensor network.
Crucially, anomaly detection in logistics must work online (real time) and at scale. Data points arrive constantly as trucks move, and decisions (rerouting, dispatching technicians) often need to happen immediately. The best systems act like “early-warning” engines: they continuously analyze streams and alert operators to any outliers. The benefits are substantial. For instance, one industry report claims that using AI-based anomaly detection helped companies prevent about 65% of potential supply-chain disruptions – translating to roughly $50 million in saving. In other words, by catching oddities early (like a trailer’s refrigeration fault), businesses can intervene before inventory is ruined.
Techniques vary depending on the scenario:
-
Real-time (online) detection: Useful for urgent issues (e.g. a reefer door left open). Models scan incoming data on the fly. For example, a streaming LSTM might process the last few hours of temperature data and trigger an alert if the trend suddenly spikes above normal variance. The trade-off is computational: online models must be efficient to handle high-velocity data.
-
Batch (offline) analysis: Often used for deeper analysis of historical runs. Here one can rerun full datasets with heavier models or retrain on new data. This is useful for refining baselines or catching slow drifts that real-time filters might miss.
In practice, anomaly detection often uses hybrid rules + ML. A shipping company might set nominal temperature limits (e.g. 2–8°C for pharma), then use an ML model to suppress false alerts (for example, ignoring a brief outlier during a known “door open” event detected by an accelerometer). One cold-chain study implemented exactly this: using cellular data loggers with paired temperature probes, a logistics operator set up business-defined thresholds and a decision support system that only alerted when a real anomaly (outside threshold and not due to door-opening) was detected. This reduced false alarms while still catching true refrigeration failures.
Predictive Maintenance and Forecasting
Beyond detecting current anomalies, data scientists build predictive models to forecast future issues. In cold logistics, this means predicting equipment failures (predictive maintenance) and estimating shipment outcomes.
Predictive maintenance. Refrigerated trucks, cooling units, and even the IoT sensors themselves need upkeep. Machine learning can analyze patterns in sensor data (e.g. compressor current draw, vibration, or historical uptime) to predict when a machine is likely to fail. For example, if telemetry shows a gradual increase in a freezer’s temperature despite normal settings, a regression model might forecast an imminent breakdown. Scheduled maintenance can then be moved forward, avoiding catastrophic failure en route. Industry data underscore the ROI: predictive maintenance algorithms have been shown to cut unplanned equipment downtime by up to 50% and reduce repair costs 10–20%.
Route and demand forecasting. Sensor data also feeds classic supply-chain forecasting. For instance, if an IoT-enabled fleet of trucks logs location and speed, one can train models to predict arrival times under varying traffic and temperature conditions. Seasonal patterns (e.g. summer vs. winter shipping delays) can be incorporated. Similarly, combining IoT shipment counts with past sales data helps forecast demand and inventory needs. While these topics are broader than cold-chain anomalies, they share the same ML foundation: time-series regression and classification models improve operational efficiency.
In all these cases, the key is data quality. As one report bluntly put it: even the best ML model is “only as good as the data you feed”. Thus cleaning and properly timestamping the IoT streams is essential before feeding them into ML pipelines. Once the data is reliable, the gains are clear: early fault detection, optimized maintenance scheduling, and improved supply forecasting all stem from the same sensor data.
Eelink’s IoT Devices in the Data Pipeline
At Eelink, we design our IoT trackers and sensors to serve exactly these analytics needs. Our devices (like the LTE‑M BTT01 temperature/humidity sensor or NB‑IoT trackers) start by collecting multi-dimensional data continuously. Each unit typically records temperature, humidity, and GPS once per minute (configurable), and can even include accelerometer or light sensors for tamper/event detection. Because these readings are time-stamped, we obtain a rich multivariate time series per shipment or asset.
Next, devices transmit that data wirelessly to back-end servers (via a cellular or satellite network). Eelink trackers can operate on public networks or private LoRaWAN/NB‑IoT networks. The data then flows through a gateway to cloud storage. In our experience, a common architecture is:
-
Edge data caching: Devices often store readings locally if connectivity is intermittent (e.g. deep inside a container). Once the network is available, they bulk-upload missed records.
-
Gateway ingestion: Cellular routers or customer infrastructure collect the device packets and push them to an IoT platform (e.g. via MQTT or REST API).
-
Cloud database: On the server side, data is saved in a time-series database or warehouse (InfluxDB, Timescale, or even cloud-native logs). This centralized data lake allows batch queries and model training.
-
Analytics layer: Data scientists then build features (rolling averages, deltas, historical baselines) and apply ML models (often in Python or Spark). Results – anomalies, predictions – are fed into dashboards or alert systems.
Throughout this pipeline, Eelink devices are engineered for reliability. For cold chains, our trackers use low-drift sensors (±0.2°C accuracy) and battery management to last through long trips. We also optimize for edge computing: some models (like simple threshold checks or filtering) can run on-device to reduce cloud load. For example, a device might suppress reporting if readings are within normal variance and only push data on an event or periodic heartbeat. This conserves energy and network usage.
The data these devices generate powers the analytics. For instance, consider a fleet of refrigerated containers: each one is tagged with an Eelink temperature logger. The continuous time series from these loggers enable computing trend patterns (e.g. cooling curves when a truck starts) and detecting when a curve diverges. Visualization tools can show this in real time, while ML algorithms flag any anomalies (like a persistent 3°C drift). By integrating device hardware with data science workflows, we help logistics teams move from reactive (fix after spoilage) to proactive (fix before spoilage) operations.
Industry Trends and Outcomes
The convergence of IoT and analytics in logistics is a major industry trend. Analysts report that the global market for cold-chain IoT solutions was about US$5.95 billion in 2023, with a compound annual growth rate of ~13.8% (reaching ~$19.06 billion by 2032). Similarly, the broader predictive-analytics sector is growing rapidly (forecast at 22.4% CAGR through 2032). Logistics companies are investing: one survey found over 50% of enterprises planned to increase their IoT budgets in 2024.
Early adopters are seeing measurable benefits. For example, real-time IoT tracking has cut waste and spoilage significantly in food distribution. An IoT‑enabled monitoring pilot in Europe reported that predictive alerts for refrigeration faults greatly reduced out-of-spec events. In warehousing, companies using sensor data to guide maintenance have achieved 20–50% less downtime. Even energy costs drop: analytics of cold-room power usage can trim consumption by double-digit percentages. More broadly, machine-learning applications in supply chain have helped businesses recoup 6500+ hours in productivity and save millions in operating costs.
Overall, analytics-driven logistics boost both efficiency and resilience. Data makes hidden problems visible: for example, IoT data can reveal if a certain route or facility consistently records anomalies, suggesting systemic issues. This transparency is also valuable for compliance (e.g. proving cold-chain integrity to regulators or customers). With advanced anomaly detection and forecasting, supply chains become more predictive – turning what used to be reactive firefighting into continuous improvement.
Conclusion
Cold-chain logistics is inherently complex and risky, but data science offers powerful tools to tame it. By deploying IoT sensors like those from Eelink and applying time-series analytics, companies can detect anomalies in real time and predict problems before they happen. This not only reduces spoilage and saves money, but also improves sustainability by cutting waste. As IoT adoption grows (tens of billions of connected devices worldwide), the analytical techniques will only get more sophisticated. For supply-chain engineers and data scientists, this means continually improving models – from simple threshold alerts to deep-learning predictors – all fueled by the data streaming in from every truck, container, and pallet. The future of cold chain is data-driven, and the insights unlocked today will keep global supply networks efficient and secure.